

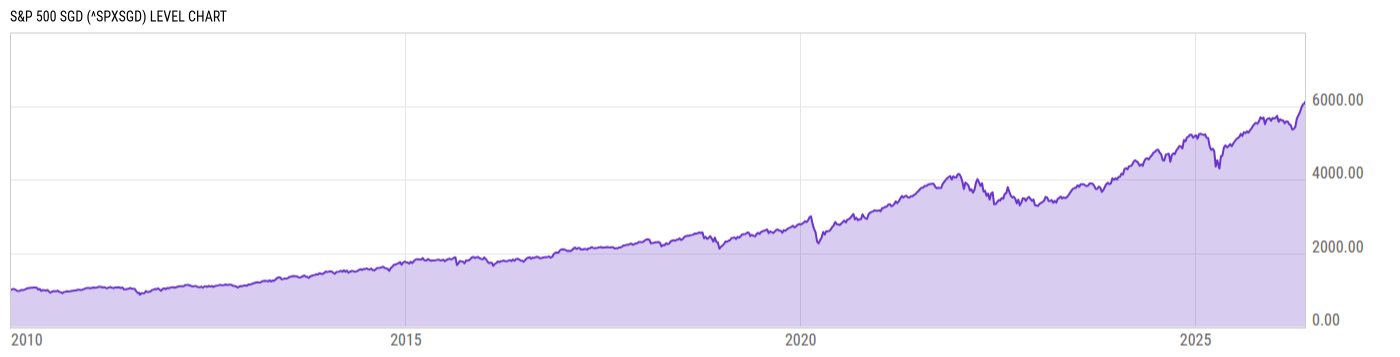
S&P 500 SGD (^SPXSGD)
6109.39
+23.16
(+0.38%)
SGD |
May 22, 20:00
Level Chart
Key Stats
Basic Info
| N/A | |
| Core Index Name | S&P 500 |
| Return Type | Price Return |
| Currency Code | SGD |
| Category Hedge Type | Not Hedged |
Index Varieties
| Return Types | |
| Net Total Return | S&P 500 Net Total Return SGD |
| Total Return | S&P 500 Total Return SGD |
| Currencies | |
| AUD | S&P 500 AUD |
| BRL | S&P 500 BRL |
| CAD | S&P 500 CAD |
| CHF | S&P 500 CHF |
| CNH | S&P 500 CNH |
| CNY | S&P 500 CNY |
| EUR | S&P 500 EUR |
| GBP | S&P 500 GBP |
Total Return Performance
As of May 22, 2026.
Returns for periods of 1 year and above are annualized.
Annual Performance
As of May 26, 2026.
Basic Info
| N/A | |
| Core Index Name | S&P 500 |
| Return Type | Price Return |
| Currency Code | SGD |
| Category Hedge Type | Not Hedged |
Index Varieties
| Return Types | |
| Net Total Return | S&P 500 Net Total Return SGD |
| Total Return | S&P 500 Total Return SGD |
| Currencies | |
| AUD | S&P 500 AUD |
| BRL | S&P 500 BRL |
| CAD | S&P 500 CAD |
| CHF | S&P 500 CHF |
| CNH | S&P 500 CNH |
| CNY | S&P 500 CNY |
| EUR | S&P 500 EUR |
| GBP | S&P 500 GBP |